Data Science Interview Questions and Answers 2023

Data Science is among the fascinating subjects of the 21st century. Both the employees and employers are aware of the perks of the job. Where organizations benefit by extracting meaningful information from raw data, employers get to learn how data influences business decisions (and get high payouts).
Researchers claim that data science is all set to revolutionize the way businesses conduct everyday operations, helping them better their overall strategies. Organizations that plan to leverage their enterprise data are in a better position to sustain the competition and thrive in the dynamically changing business world. Hence the need for professionals who can do the job, aka Data Scientists.
Now as much easy as it may sound, getting a data scientist job or pursuing your career in data science isn't simple. One must have significant knowledge and the expertise to walkthrough data, unleash its value and render insights beneficial for the organization. If you are gearing up to appear for an interview, starting from scratch isn't wise.
To help you in this regard, we have designed a piece covering Data Science Interview Questions.
Basic Data Science Interview Questions
- Explain the differences between supervised and unsupervised learning?
- What is selection bias in data science and its types?
- Explain bias-variance trade-off?
- What is the goal of A/B testing?
- Explain logistic regression?
- What is linear regression? Explain in simple terms.
- Which is better for text analytics: Python or R?
- Outline commonly-used Python data analysis libraries.
Data Science Interview Questions For Freshers
- What is a confusion matrix?
- How to make a decision tree?
- Explain cross-validation
- What are the disadvantages of a linear model?
- Explain types of sampling.
- What is a true positive rate and a false positive rate?
- Can you cite an example where a false positive is more important than a false negative?
- What is ‘Naive’ in a Naive Bayes
Data Science Interview Questions For Experienced Professionals
- What's the difference between logistic regression and support vector machines?
- Explain how to find clusters in a clustering algorithm?
- Differentiate between deep learning and machine learning?
- What do you understand by the Box-Cox transformation?
- What is Pooling on CNN?
- What is the ROC curve?
- What is "random" in a random forest?
- What are the common ways of handling missing data?
Basic Data Science Interview Questions
1. Explain the differences between supervised and unsupervised learning?
Supervised machine learning is a training model where the algorithm is given a set of labeled data to learn. To clarify, we teach the model using a predefined set of labeled data. Later, we add a new data set and the supervised machine learning algorithm analyzes the data to render the appropriate outcome.
For example, let's say we trained the model using a set of vegetables. Initially, the model learned about the different vegetables in the basket. Now if we give a carrot as an input, the algorithm is now supposed to identify the vegetable. As evident, the model works by learning and then classifying.
On the contrary, unsupervised machine learning, as the name suggests, doesn't involve any kind of supervision. We expect the model to analyze, detect patterns, and then group similar objects. Unlike supervised machine learning, unsupervised machine learning has no labeled data and works on its own.
| Parameters | Supervised Machine Learning | Unsupervised Machine Learning |
| Input Data | Train models using labeled data | Train models using raw, unlabelled data |
| Complexity | Since supervised ML uses labeled data, analysis and implementation is simple | Since we expect the algorithm to learn on its own, this method is comparatively complicated |
| Level of accuracy | Fully accurate | Partially accurate |
| Category of Algorithm | Classification, Regression | Clustering, Association |

2. What is selection bias in data science and its types?
Selection bias is an error that occurs when the researcher manually picks the data, individual, or group to study them. To clarify, the subjects aren't random, and there lies the possibility that the chosen sample does not possess characteristics of the actual population.
If selection bias is not considered, then the end solutions aren't accurate. This is because the presence of selection bias in sampling disrupts the statistical analysis leaving an impending effect on the bias statistics. Selection bias is also named as the selection effect. When we talk about selection bias, it isn’t limited to the samples chosen but extends to other parameters as well.
The common types of selection bias include:
- Sampling Bias: This is a subtype of selection bias in data science. Sampling Bias occurs when the chosen sample is not random and there exist members with a minimal possibility to be part of the sampling. Therefore, the sample can have members with greater weightage on the sampling process.
- Data Bias: When you segment data in a particular manner and run tests designed for random partition.
- Bias in Time Interval: When a trial is purposely terminated before time.
- Attrition Bias: When you lose a certain number of participants long before the completion phase, attrition bias occurs.
Example: A selection bias example is of publication. Journalists tend to publish stories that are more likely to garner the reader's attention.
3. Explain bias-variance trade-off?
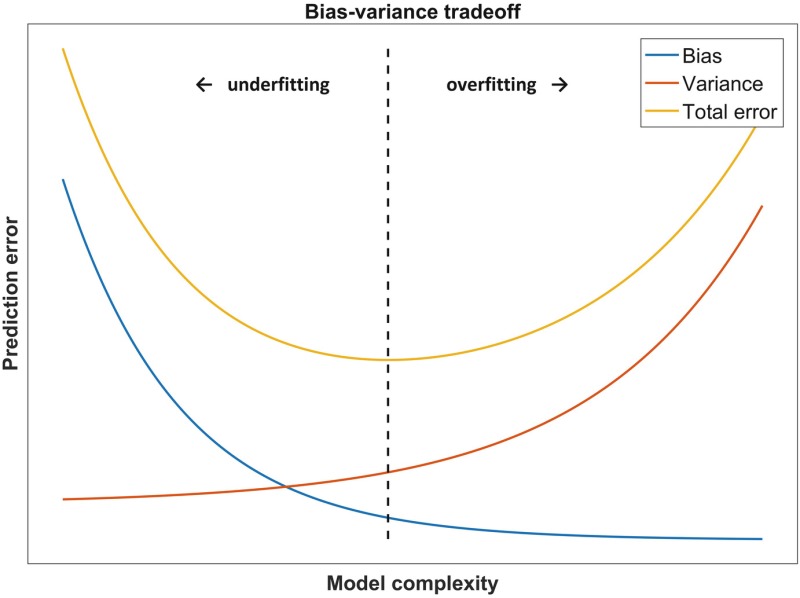
Bias and variance are two errors in machine learning. Bias is introduced when the algorithm is too simple whereas variance is added when the algorithm is over complicated.
That is to say, if a model is too simple and has minimal parameters, it has high bias and low variance. Contrarily, a model with multiple parameters has high variance and low bias. Hence, there is a need for a bias-variance trade off.
Certainly, the algorithm strives for low bias and variance. Bias-variance trade off is a situation where the researcher tries to achieve a balance between the two errors. And while doing this, the bias-variance trade off maximizes the performance and efficiency of the algorithm.
The following graph depicts the point of optimal complexity between bias and variance.
4. What is the goal of A/B testing?
A/B testing is primarily a hypothetical testing done using two variables A and B. Let's say you have a landing page designed for your business. You would want the page to be beautiful, appealing, and as per the customer's expectations. This is where marketers perform A/B testing. To understand better, let's see how can A/B tests help you with web design.
The original design is A and a few changes here and there makes it B. Present the designs to the sample audience and track their responses. Based on the information here, you can decide which design is more likely to attract customers.
5. Explain logistic regression?
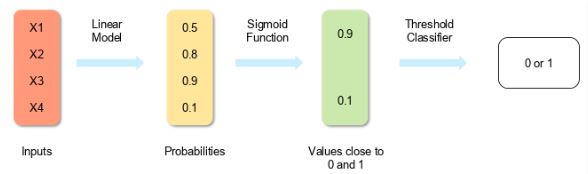
A type of classification algorithm and applicable only when the subject variables (the dependent ones) are binary. Compared to the linear regression algorithm that predicts continuous values, the logistic regression model involves categorical response.
In other words, the logistic regression model is a special type of linear regression with categorically defined outcomes. It has a binary dependent variable and a dichotomous output variable. A log function is used to make predictions on the outcome.
Example to understand what is a logistic regression model:
Let's say you want to predict whether it will rain in New York today. Here, the dependent variable is temperature and the possible outcome is it rains or it doesn't. With logistic regression implementation in data science, you can categorically specify if it would rain: yes or no!
However, if you wish to determine the amount of rain at different intervals, use linear regression.
6. What is linear regression? Explain in simple terms.
By definition, linear regression is a type of machine learning algorithm that strives to determine the relationship between variables. Therefore, out of the two variables in linear regression Python, one is dependent and the other is independent.
For example, let's say you have a device that tracks the number of hours you sleep along with the timestamp and later in the morning asks you to rate how you feel on a scale of 1-10 ( becomes better as you advance). Here, the time duration and the sure are the independent variables.
However, your mood or the variable depicting how you feel is the dependent variable. With linear regression, we draw a linear relationship between the two variables. This shows how a change in the dependent variable would affect the independent variable.
7. Which is better for text analytics: Python or R?
Python has a huge repository of data structures helpful for analyzing data and making predictions. The presence of Pandas library is a bonus making it easier for the researchers to enter into data analysis and similar tasks. R, on the other hand, is best for statistical analysis. So if one has the option of Python or R for text analysis, Python is the best bet.
8. Outline commonly-used Python data analysis libraries.
- NumPy
- Pandas
- SciKit
- Matplotlib

Data Science Interview Questions For Freshers
1. What is a confusion matrix?
Unlike its name, a confusion matrix clarifies all confusions related to the classification algorithm of machine learning.
Conventionally, the algorithm groups similar variables into classes. It takes into consideration the kind, the pattern, and the characteristics of each variable before classifying it as a certain type.
Once done, researchers analyze the performance after grouping. Subsequently, the outcome obtained helps modify the classification algorithm and reclassify them. One question here is how to assess the performance of the model. This is where the confusion matrix helps.

Statistically, confusion matrix Python is a n x n matrix used to analyze the performance of a model. The matrix has actual values versus the expected values. In other words, the confusion matrix Python implementation has n rows with predicted outcomes and columns with actual outcomes. Based on the cell values, researchers quantify the performance of the model.
2. How to make a decision tree?
Decision Tree is a machine learning algorithm that can be used for both regression and classification problems. The internal node is labeled with the input (parent node) which is connected to the external ones in a hierarchical manner. The external nodes are labeled with the possible values of the input feature.
Decision Tree is an important concept and applicable when solving supervised machine learning problems. To build a decision tree, follow the steps given below:
- Find the best attribute to split the records. It is best to apply the Attribute Selection Measures(ASM) when selecting the attribute.
- The chosen attribute is the internal decision node.
- The attribute is broken into smaller subsets and each set is made the child mode.
This starts the tree building process. Repeat the steps for each child, until either of the given conditions stand true:
- All tuples are part of the same attribute value.
- There aren't any instances or attributes left.
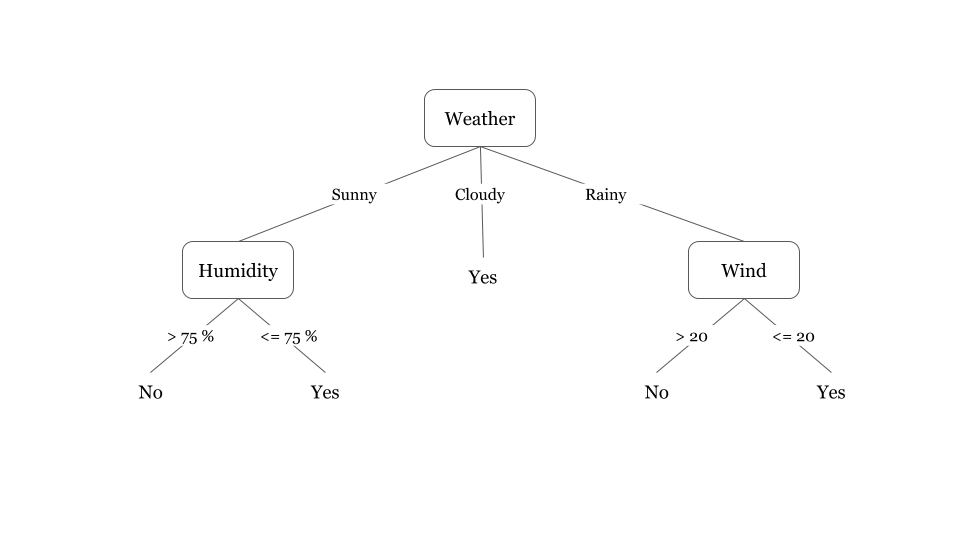
Suppose we create a tree to find if it rains tomorrow in London or not. Decision tree for this is:
3. Explain cross-validation
Cross-validation in data science is a technique where part of the data set is reserved for testing purposes whereas the remaining is used to train the model. There are three different ways to implement cross-validation.
Validation: In this method, we divide the training dataset into half. 50% of the data is used to train the model whereas the other 50% is used to test the performance of the model.
LOOCV (Leave One Out Cross Validation): Here, the entire dataset is used to train the model except one. To clarify, we leave out only one data from the entire set. This is then used to test the efficiency of the model.
K Fold Cross-validation: The most efficient is K Fold Cross-validation. Here, the dataset is divided into k subsets. We train the model using all datasets with k-1 left to test the model. The method involves iterating the dataset k number of times. Every time, we have a different subset for conducting the model testing operation.
4. What are the disadvantages of a linear model?
A linear model is a concept that assumes the presence of a linear relationship between the dependent and the independent variables. In reality, data is not linearly separable and so the assumption limits the real-time implementation of the model.
5. Explain types of sampling.
Sampling is a process of drawing out observations from a huge population or say, samples from a dataset. Primarily, there are two types of sampling:
Probability Sampling
This is one of the common types where all of the subjects have equal selection probability. This is also called random sampling as the participants are chosen randomly. In other words, probability sampling assures that everyone in the population gets a chance to take part in the process.
The commonly used types of probability sampling include:
- Simple Random Sampling
- Stratified sampling
- Systematic sampling
- Cluster Sampling
Non-probability Sampling
This is one of the biased kinds where the researcher selects the samples from the population in a certain manner. To clarify, non-probability sampling in data science doesn't depend on randomization and the members of the population do not have equal selection probability.
The types of non-probability sampling include:
- Convenience Sampling
- Purposive Sampling
- Quota Sampling
- Referral /Snowball Sampling
6. What is a true positive rate and a false positive rate?
Classification is a supervised machine learning algorithm used to group similar data into classes. Typically, when a data science algorithm gets a problem, it gathers the required data, cleans it, adds features if needed, and then uses it to train the model. Once the model is ready, we test it and measure the performance. Hence, depending upon the performance, the model is then refined and trained to get a better output.
Now to measure the performance, we adopt a standard mechanism of comparing the actual value with the predicted value. Thereafter, the closer the predicted value, the better is the performance. This is where the concept of true positive rate and false positive rate comes into play.
The comparison between the true positive rate and the false positive rate is depicted through an nxn confusion matrix. Here, n is the number of variables. Also, we will see how to calculate the true positive rate through the matrix.
- True Positive (TP): When the actual value is positive and the predicted value also is positive. In other words when both predicted values and the actual value is positive.
- True Negative (TN): When the actual value and the predicted value is negative. In other words when both predicted values and the actual value is negative.
- False Positive (FP): When the actual value is negative but the predicted value is positive. In other words when the negative examples are misinterpreted as positive.
- False Negative (FN): When the actual value is positive but the predicted value is negative. In other words when the positive examples are misinterpreted as negative.
7. Can you cite an example where a false positive is more important than a false negative?
A false positive is a case when the model returns a positive output for negative (actual value). False negative is the opposite of the above. Now consider that a patient appeared for an HIV test. A false positive here would lead to confusion and call for additional tests.
However, if the test result is a false negative, it can cost the patient his/her life. As a result, false positives are more important than a false negative.
8. What is ‘Naive’ in a Naive Bayes
Naive Bayes is a machine learning algorithm (predictive modeling) that is based on the Bayes theorem. It isn't a single algorithm but a group of them and hence the name, Naive Bayes classifier. The Bayes theorem is a mathematical model used to calculate conditional probability. Extending the same, the Naive Bayes algorithm in data science assumes that each of the features within the measurement is independent of each other.
Data Science Interview Questions For Experienced Professionals
1. What’s the difference between logistic regression and support vector machines?
| Logistic Regression | Support Vector Machines | |
| Definition | Classifies elements and can have more than one decision boundary. | Support Vector algorithm is a machine learning algorithm that strives to find the optimal margin and separate the classes. It has one and only one decision boundary. |
| Category of problems | Classification. | Classification and Regression. |
| Works with | Independent and already identified variable. | Support Vector Regression encompasses semi-structured or totally unstructured data. |
| Type of approach | Adopts a statistical methodology. | Focuses more on the geometry of the decision boundary. |
| Overfitting | Vulnerable to overfitting. | The occurrence of overfitting is minimal. |
2. Explain how to find clusters in a clustering algorithm?
While the question doesn't specify the clustering algorithm, we assume that it is about the k-means clustering algorithm. Now, the clustering algorithm is a type of unsupervised machine learning algorithm used to group similar data points together (cluster). To clarify, data points in a cluster would share properties similar to each other but different from the properties of data points is a different cluster.
K-means clustering algorithm is a specific type of the clustering algorithm where the data points are divided into k clusters. Initially, k has a random value. Based on the above, researchers group data points to their nearest cluster. Once all the data points are in their respective cluster, we take one cluster and calculate the mean of data points within it. The value obtained then helps modify the centroid position which helps to rearrange the clusters.
The process continues until all data points are in the appropriate cluster. In other words, the centroid value becomes stable. Here, we get the value of k and hence, the number of clusters.
3. Differentiate between deep learning and machine learning?
Machine Learning is a subset of artificial intelligence that uses algorithms to train models and have them act accordingly. Conversely, Deep Learning is the subset of machine learning that relies on the layers of artificial neural networks to identify data. To put it another way, where machine learning requires human intervention, deep learning functions on its own.
Machine Learning vs Deep Learning is more like learning from data vs learning from one's errors. Unlike the traditional method of inputting labeled data and learning from it, deep learning represents data in a hierarchical manner. Passing through the layers, a deep learning model can identify objects.
It is important to note that deep learning isn't feasible when the size of the dataset is small. Another thing that stands out is the execution time. Where ML models are pretty quick, deep learning algorithms take time to process. As a result, scientists often prefer machine learning over deep learning.
4. What do you understand by the Box-Cox transformation?
Technically, it is the transformation of dependent variables that aren't normal. In other words, Box-Cox transformation is the normalization of the dependent variables so that no data is skewed. When training and testing ML models with non-normal data, the predictiveness decreases.
Applying a Box-Cox transformation in data science use cases helps eliminate noise and also, conduct more tests, making it a better model.
5. What is Pooling on CNN?
It is one way to reduce the spatial dimensions where by the total number of computations occurring with the network also decreases. While there are several ways of implementing the concept, the most common method is max pooling. Max pooling on CNN replaces the elements within one region of the map with the element that has a maximum value. This summarizes the feature in a region thereby reducing parameters with the same.
6. What is the ROC curve?
It is a performance measurement curve and represented graphically with TPR at the y-axis and FPR at the x-axis. It helps to identify the appropriateness of the classification algorithm. This is where the ROC curve holds importance. In other words, the ROC curve analysis suggests how well a model can perform.
ROC curve analysis involves finding the AUC (area under the curve). The greater the area within the curve, the better is the model. To clarify, as AUC approaches value 1, the performance of the model improves.
The graph given below depicts the standard ROC curve.

7. What is "random" in a random forest?
Random forest is a classification algorithm and comprises two or more decision trees. The algorithm used here is different from that of the decision tree as a random forest algorithm has a certain level of randomness added to it. Unlike the traditional method of node splitting that emphasizes the vital feature, the random forest algorithm picks the best feature from a list of available features.
8. What are the common ways of handling missing data?
Starting with deleting the specific rows in the first place, to making predictions and the mean/median imputation methodology, you can also resort to algorithms such as random forest.
Other Backend Technology Interview Questions and Answers
C Programming Language Interview Questions | PHP Interview Questions | .NET Core Interview Questions | NumPy Interview Questions | API Interview Questions | FastAPI Python Web Framework | Java Exception Handling Interview Questions | OOPs Interview Questions and Answers | Java Collections Interview Questions | System Design Interview Questions | Data Structure Concepts | Node.js Interview Questions | Django Interview Questions | React Interview Questions | Microservices Interview Questions | Key Backend Development Skills | Python Interview Questions | Java Spring Framework Interview Questions | Spring Boot Interview Questions.